Interactive Maps
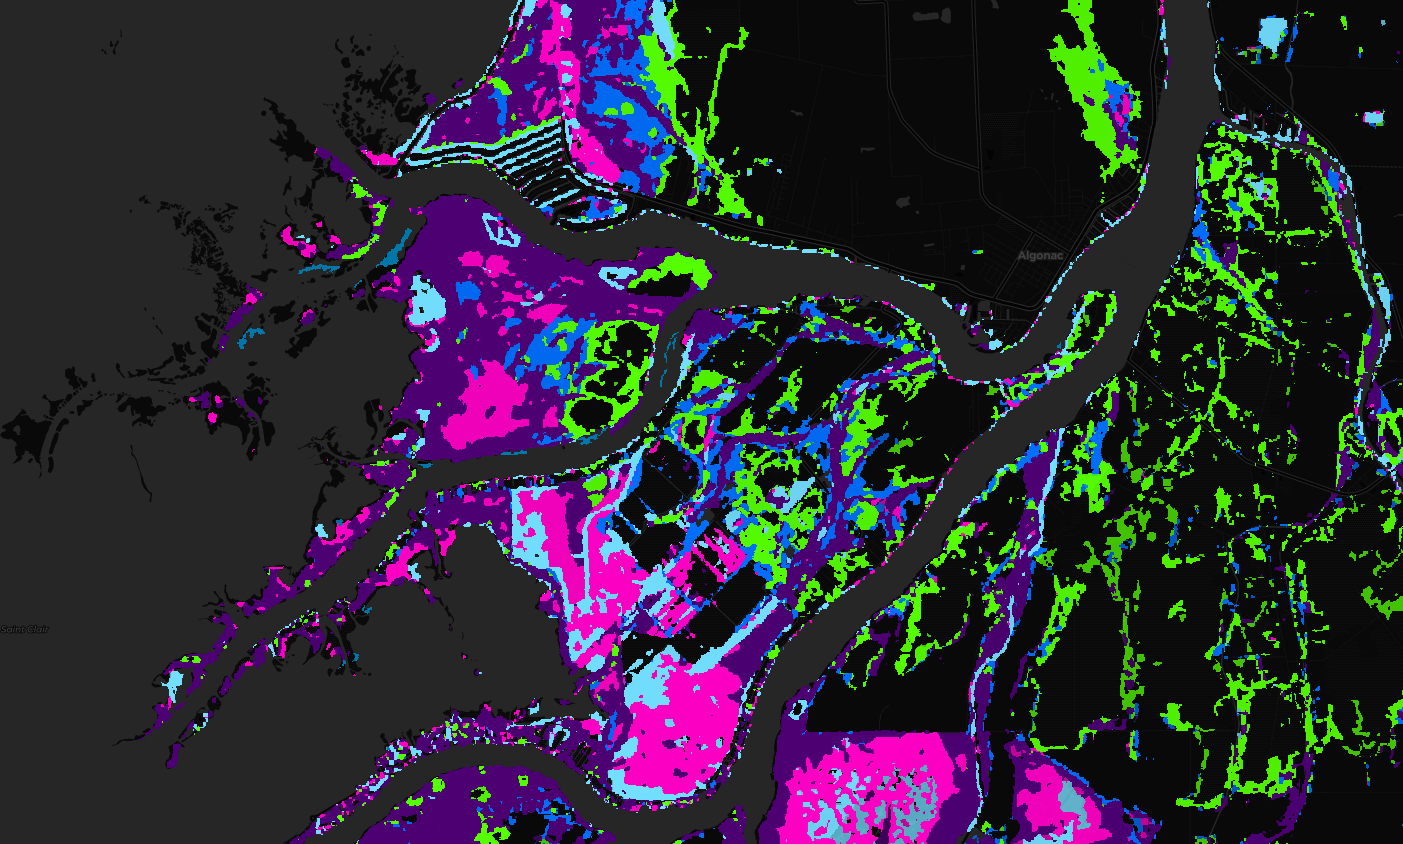
Submerged Aquatic Vegetation Classification
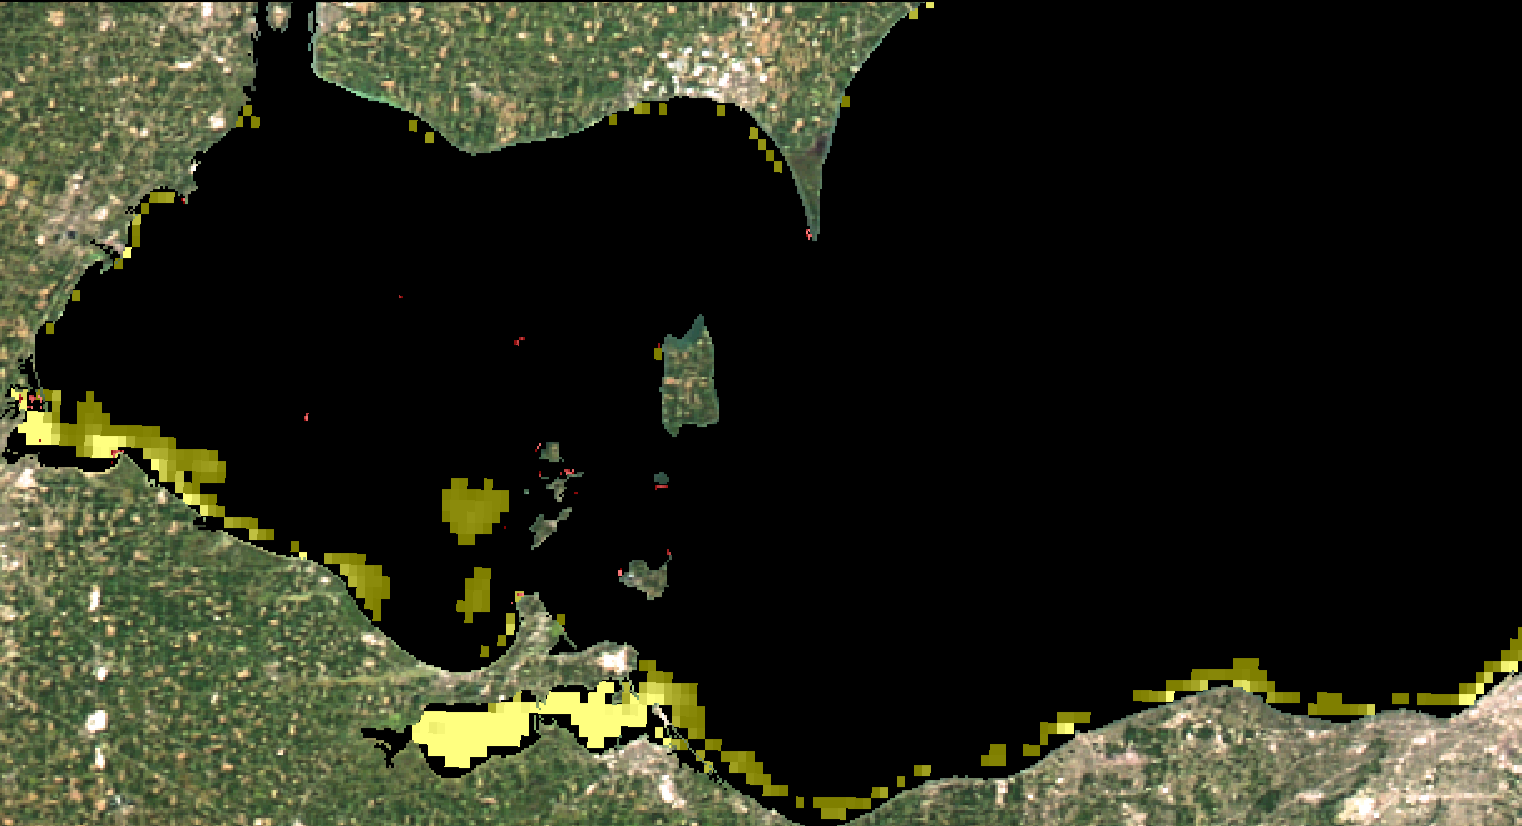
Cladophora, a nuisance, native green alga that grows attached to solid substrate in all of the Laurentian Great Lakes, has recently expanded in extent. MTRI developed an algorithm to map Cladophora and other submerged aquatic vegetation on the bottom of Lake Michigan; this map allows the user to view and interact with this data.
Water Chemistry
This map enables the user to view various remote sensing-derived products available from MTRI, including lake surface temperature, harmful algal bloom danger level, dissolved carbon, and more. The user can also filter map layers based on keywords or categories, and can measure distances and areas within the map.
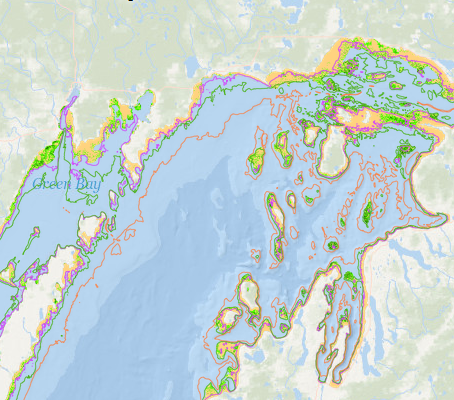
Wetlands Connectivity Map
An interactive map based on long-term monitoring of Great Lakes coastal wetlands accomplished using SOLEC (State of the Lakes Ecosystem Conference) or GLEI (Great Lakes Environmental Indicators) indicators. The weakest element of these management tools is their reliance on old, incomplete, and static landscape-scale data. This severely impacts the monitoring system's ability to detect the extent and effect from two of the most significant coastal wetland stressors: development and invasive plant species. Our map is the first comprehensive wetland delineation of the binational coastal Great Lakes, and includes adjacent land use and at least two invasive plant species: Typha spp. and Phragmites australis, using LandSat images and Synthetic Aperture Radar (SAR) imagery.
Coastal Wetlands Mapping
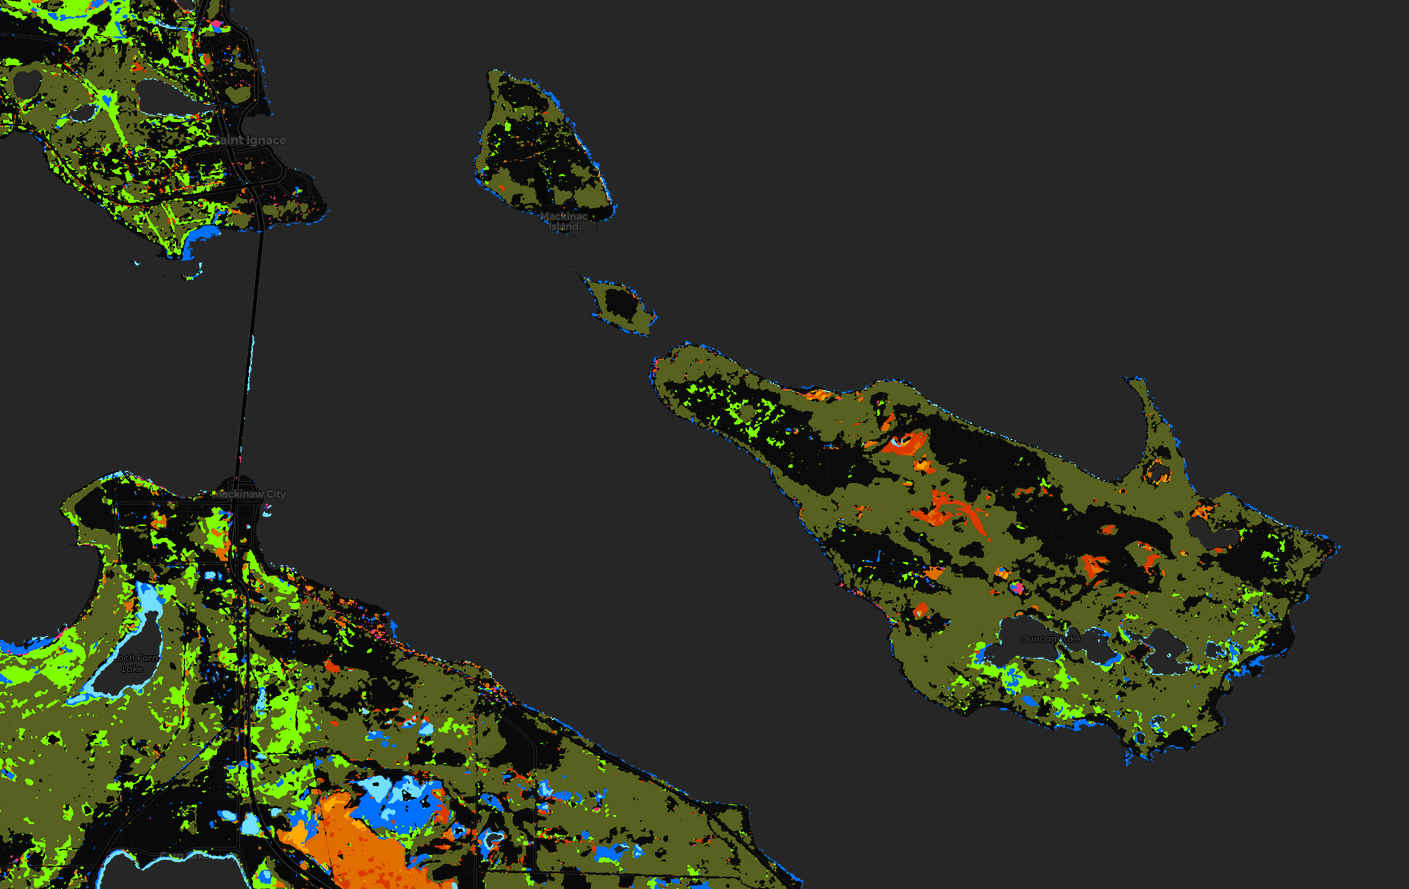
The first basin-wide map of large stands of invasive Phragmites australis (common reed) in the coastal zone was created through a collaboration between the U.S. Geological Survey and Michigan Tech Research Institute. This data set represents a revised version of that map and was created using multi-temporal PALSAR data and Landsat images from 2016-2017. In addition to Phragmites distribution, the data sets shows several land cover types including urban, agriculture, forest, shrub, emergent wetland, forested wetland, and some based on the dominant plant species. The classified map was validated using over 400 field visits.
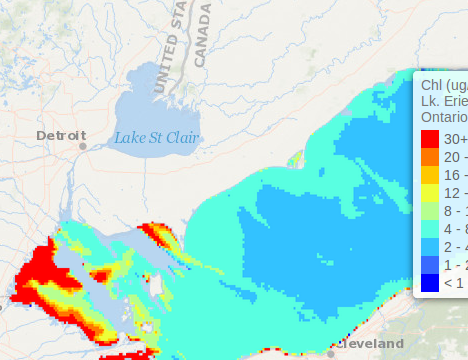
Harmful Algal Blooms
A collection of maps of algal blooms in different Great Lakes. The alge was detected using Modis, and post processing was performed to determine areas where the water quality could have health concers or HAB-related water quality concerns.
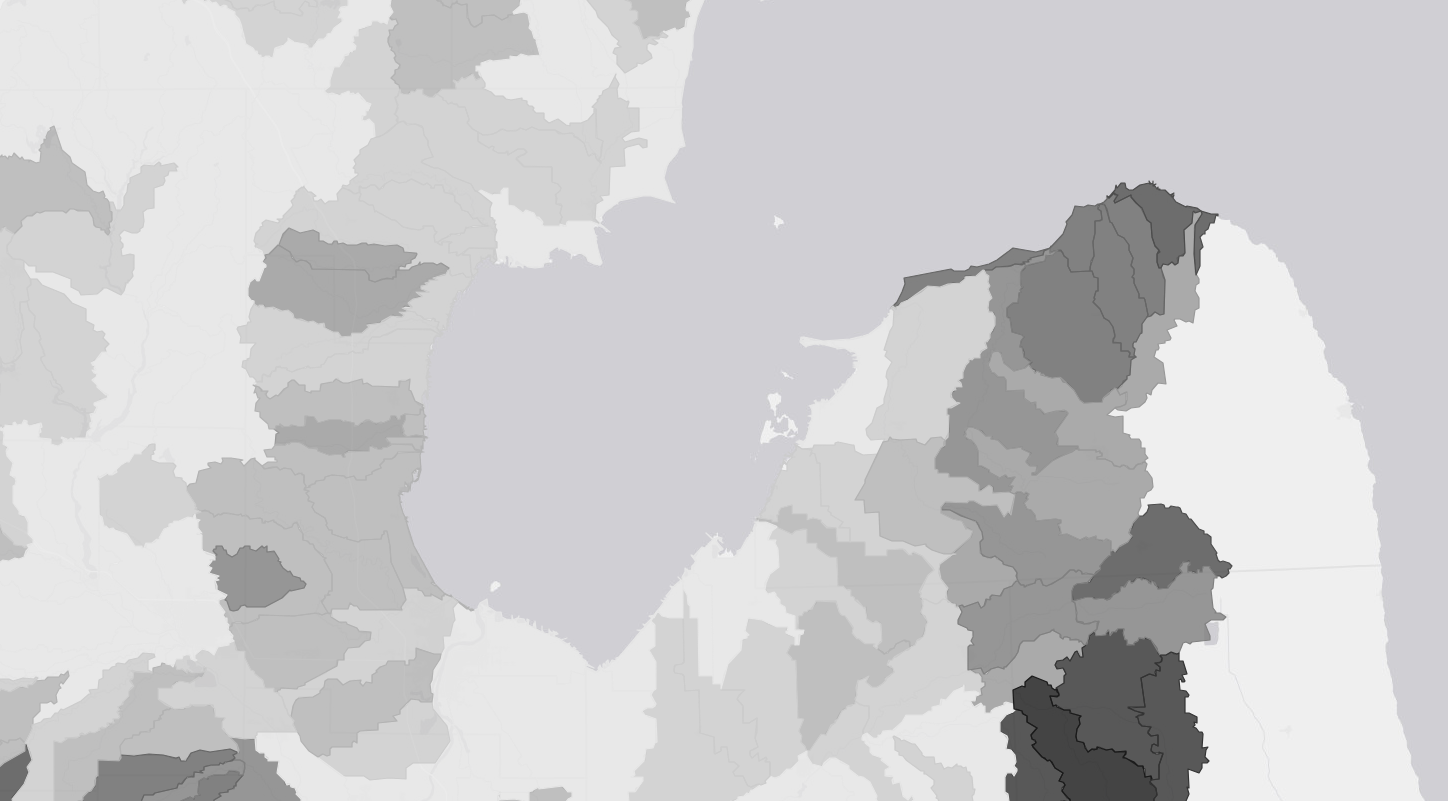
Riparian Buffer Modeling Map
This application shows hydrological model outputs of an analysis of riparian buffer effectiveness. The model quantified nutrient loading into surface waters sourcecd from urban and cropland runoff. Pixel-level (30m) estimations of how much nutrient loading is entering a waterbody can allow landowners to prioritize locations wehre maintaining riparian buffers would be most effective.